Weekly Growth Marketing Metrics
These are the operating metrics that I look at on a weekly basis for demand generation for most companies with linear funnels.
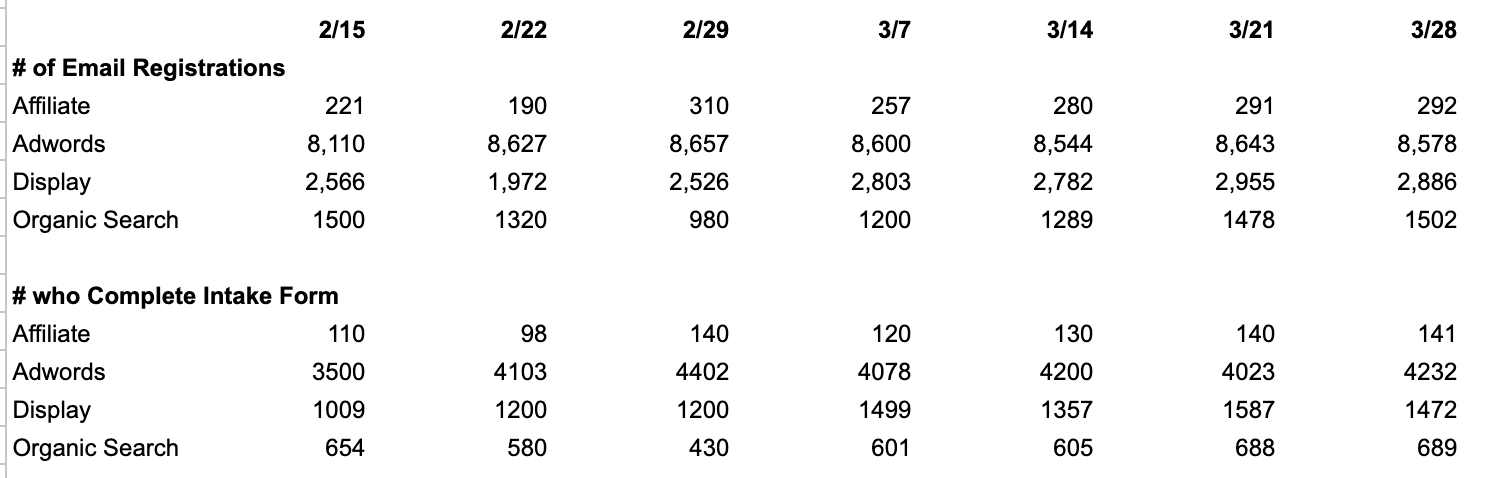
The number of users who get to each stage by week by channel. This shows me what’s responsible for the bulk of our demand and how that is changing w/w. As we get down the funnel till customers, this view shows what drives outcomes.
The conversion rate from each stage in the funnel to the next one by week by channel. This is helpful in a. Identifying bugs and places to optimize the funnel and b. Providing feedback about changes in audience quality by channel (lower quality audiences tend to convert worse through most funnels)

The payback period in months by week by channel. This shows the efficiency of each channel and basically raises the question of are we allocate our resources correctly or should we be pushing more towards the relatively efficient channels?

The cost to get a user to each stage of the funnel by week by channel. This is quite a bit less important than the other above charts but I find it’s particularly helpful in understanding leading indicators for success (i.e. cost per mid funnel) as well as what milestones you’d need to be able to achieve for achieving success in a potential new channel you might want to test

I like for the entire funnels to be cohorted by date of user creation. This means that everyone in a weekly cohort registered on that date. The reason I prefer that is the alternative is to show a report that includes how many people hit the stage in the week shown. I find that confusing because in that situation, you introduce effects of lag, so it’s harder to understand both week to conversion rates for a cohort of acquired users and its’ more complicated to understand CAC and payback period because you end up looking at cost for a week alongside results that driven by spend that occurred in a different week.
I also don’t really care what BI tool or spreadsheet is used to pull and present this data - the important thing is the analysis, not the software that shows it.
*Note that on the payback period chart above, organic search payback is calculated quickly as the resources that went into the channel during that period vs. the gross margin from the users acquired from that week, but for organic seo where the effort is front loaded but user acquisition happens for a very long period afterward, payback period should actually be calculated in a much more nuanced way